
Page 9 - 2016年线缆竞争力报告(摘要版)
P. 9
6 The competitiveness report on "the Top 10 competitiveness enterprises in the wire and cable industry of China in 2016" (Abstract Edition)
Preface • Work Summary
From 2013 to 2016, we have monitored on China’s wire and cable enterprise competitiveness for three consecutive
years. On three years in-depth analysis of the data, we have got a series of meaningful result. On one hand, the result
illustrated the change of China’s wire and cable enterprises competitiveness. On the other hand, the data of these
enterprises shows the progress and issues of China’s wire and cable market.
1. The stability and objectivity of China’s wire and cable enterprises competitiveness
The enterprises competitiveness is accumulated in the long-term development, so we can predict that overall, the
result of China’s wire and cable enterprise competitiveness is of strong stability. But due to its forming and changing
in the progress of competition, the enterprises competitiveness monitored in each year would have certain difference.
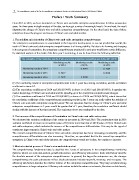
By statistical analysis of the result of the three year’s monitoring, it can be found from the following table that:
The correlation of the monitoring results of wire and cable enterprises competitiveness during 2014-2016
Monitoring results of 2014 Monitoring results Monitoring results Monitoring results
of 2014 of 2015 of 2016
Monitoring results of 2015
Monitoring results of 2016
(1) The monitoring results of enterprises competitiveness in the 3 years have strong correlation, and the correlation
coefficient is above 0.7.
(2) The correlation coefficient of 2014 and 2015(0.9097) is above it of 2015 and 2016(0.8038). It matches the
market deepening of China’s wire and cable and the speeding up of the enterprises competitiveness changes.
(3) The correlation coefficient of 2014 and 2015(0.9097) is above it of 2014 and 2016(0.7429), which shows that
the correlation coefficient of the competitiveness monitoring results in the 3 years can really reflect the stability of
China’s wire and cable enterprises competitiveness. We can speculate that the change of China’s wire and cable
enterprises competitiveness in 2 years would be greater that of 1 year, therefore, the correlation coefficient should
decline with the increase of the time interval. The conjecture above was confirmed by the data.
2. The increase of the competitiveness differentiation in China’s wire and cable enterprises
We calculated the variation coefficient of the return on net assets in 2014 and 2016. The results show that in 2016
variation coefficient of return on net assets (value of 53) is far more than that of 2014(value of 39) in China’s wire
and cable enterprises, which indicates the increase of the competitiveness differentiation. This may be the signal of
continuous improvement in China’s wire and cable market.
The overall competitiveness of China’s wire and cable enterprises has been increasing incessantly, and the
competitiveness differentiation are also increasing. Therefore, we speculated that for the several top competitive
enterprises in China’s wire and cables industry, the competitiveness would not decline, but continue to increase.
3. Market-oriented process of China’s wire and cable market
The competitiveness fundamental data is classified into 3 sorts of sub-sectors in the competitiveness monitoring
systems, which are scale sub-sectors, growth sub-sectors, and efficiency sub-sectors. Scale sub-factors describe
the absolute amount of the enterprises competitiveness. In general, the larger the enterprises are, the stronger
competitiveness the scale sub-sectors reflect. Scale sub-sectors include net profit, revenues, and net assets. The
efficiency sub-factors describe the relative volume of the enterprises competitiveness. They may not show strong
competitiveness in large enterprises. Efficiency sub-sectors include the return on net assets, the return on total assets,