
Page 13 - 2016年线缆竞争力报告(摘要版)
P. 13
Chapter 1 Ranking of "the Top 10 competitiveness enterprises in the wire and cable industry of China during 2015-2016" 10 The competitiveness report on "the Top 10 competitiveness enterprises in the wire and cable industry of China in 2016" (Abstract Edition)
1. Ranking of "the Top 10 competitiveness enterprises in the wire and cable industry of China during 2015-2016"
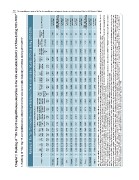
Ranking of the Top 10 competitiveness enterprises in the wire and cable industry of China during 2015-2016
Standard value weighted of the financial data(70% weight) Standard value weighted of the survey data(30% weight)
Return Return Sales The ratio of The average The average Total Management Comprehensive
on total on net revenues international growth rate of growth rate standard level of Corporation Total standard index of Comprehensive
Company Sales Net Net assets assets contribution revenue sales revenues of net profit Technology Customer Brand culture value weighted competitiveness score of
Ranking revenues assets profit for the last value innovation satisfaction awareness enterprise Source of financial data
weight per to total sales for the last three years weighted of of the survey
weight weight 8% employee revenues three years the financial weight weight competitiveness
18% 13% weight 34% 18% data $
%
15% data %
weight weight weight weight weight $ weight weight weight
13% 8% 5% 6% 14% 12% 11%
25%
Hengtong 1 1.8408 0.3965 0.0585 0.0947 0.1437 0.0412 0.0014 0.0085 0.0113 2.5965 0.6314 0.5000 0.5771 0.6442 0.5060 2.8587 2.6751 1000 Annual report of
listed company
Shangshang 2 1.3706 0.1994 0.0278 0.2509 0.0737 0.1279 -0.0008 -0.0042 -0.0008 2.0445 0.6220 0.5281 0.6364 0.6029 0.4732 2.8626 2.2899 987 Taxationǃresearch ˂ survey
Baosheng 3 1.6473 0.1135 0.0123 -0.0314 0.0470 0.0947 -0.0001 0.0047 0.0073 1.8952 0.6182 0.5816 0.6454 0.5645 0.4531 2.8628 2.1855 information˗self-reported figures
and grid companies' tender results
984 Annual report of
listed company
ZTT 4 1.0498 0.2336 0.0379 0.1956 0.0765 0.0671 0.0075 0.0215 0.0126 1.7021 0.5937 0.5811 0.4345 0.6099 0.5054 2.7246 2.0089 978 Annual report of
Jiangnan 5 1.0825 0.3199 0.0638 0.1747 0.1451 0.0901 -0.0007 0.0079 0.0116 1.8950 0.4320 0.4224 0.5106 0.5087 0.4002 2.2739 2.0086 977 listed company
Hanhe Cable 6 0.4894 0.2829 0.0293 0.1675 0.0709 0.0447 -0.0013 -0.0024 0.0110 1.0920 0.5913 0.5023 0.4504 0.5016 0.4003 2.4459 1.4982 963
Annual report of
listed company
Annual report of
listed company
Zhongli 7 0.5861 0.2939 0.0332 0.0025 0.1061 0.0495 0.0061 0.0113 0.0032 1.0917 0.6219 0.4224 0.4394 0.5586 0.4002 2.4425 1.4969 962 Annual report of
1.4740 listed company
1.4562
Futong 8 0.5115 0.2373 0.0352 0.1357 0.0653 0.0637 -0.0019 0.0110 0.0012 1.0590 0.6205 0.4564 0.2509 0.6058 0.5087 2.4423 1.3968 Taxationǃresearch ˂ survey
960 information˗self-reported figures
and grid companies' tender results
Tongling Jingda 9 0.7020 0.1584 0.0046 0.0553 0.0217 0.0994 0.0015 -0.0067 -0.0028 1.0334 0.4745 0.4304 0.4613 0.5797 0.4969 2.4428 958 Annual report of
listed company
Wanma 10 0.4902 0.1719 0.0219 0.1361 0.0645 0.0522 -0.0026 0.0090 0.0056 0.9487 0.5019 0.4420 0.5395 0.5585 0.4006 2.4425 956 Annual report of
listed company
Note 1: Enterprises qualified for the competitiveness selection in the wire and cable industry of China shall have 2 or more items of relevant products as core businesses.
Note 2: For sales revenues and net profit indicator, due to enterprises’ sales revenues from diversified products revenues, the data we collect is based on the revenues of relevant products of wire and cable business and net profits of relevant wire and cable products. The net profit
rate will be calculated by relevant products contribution rate in sales revenues, if the enterprise listed does not reveal net profit of relevant products in its annual report. Net asset data is collected from the wire and cable group of the enterprise.
Note 3: As for the other six indicators (of return on net assets, return on total assets, sales revenues contribution per employee, the ratio of international revenue to total sales revenues, the average growth rate of sales revenues for the last three years and the average growth rate
of net profit for the last three years), we refer to the released annual reports of the enterprises listed in the rankings, and make no more in subdivision.
Note 4: Return on net assets can be defined in different formula. To avoid the incomparable problem of net profit caused by the different corporate income tax rate in listed companies and unlisted companies, we define the molecular in the formula as net profit before tax instead of
net profits. The formula of calculating return on net assets is: Return on net assets=net profit before tax/ net assets; Return on total assets=Net profits before tax/ total assets.
Note 5: From the monitoring data, it is found that if the enterprise competitiveness comes mainly from the increase indicators (that is, the average growth rate of revenues for the last three years & the average growth rate of net profit for the last three years), the monitoring data of the
enterprise competitiveness is usually unstable. The main reason for the enterprise competitiveness instability is that the original sales revenues base in these enterprises was small and the increasing sales revenues of recent 2 years make the average growth rate of the past 3 years
far higher than the industry average level. The extremely high standard value of a certain indicator in the company may cause the standard value of financial data competitiveness index over high on the whole. But in the second or third years, when the growth rate of sales revenues
drops to the normal average level and instead there is no higher growth in the other indicators, the monitoring index of the enterprise competitiveness will decline significantly. To avoid the impact of abnormal change in financial indicators on the objectivity of the enterprise
competitiveness evaluation, we find a practical way to improve it. That is, we set the upper and low limit of standard value in the increase indicators (the average growth rate of revenues for the last three years & the average growth rate of net profit for the last three years) within [-1,1].
With the consistency of statistical test, the overdone impact on overall standard value of financial data by the abnormal data of growth index can be eliminated.