
Page 26 - Analysis Report of Global Market in the Submarine Cable Field (2017)
P. 26
Wire and Cable
Since May 1st 2013, the newly adjusted wire and cable industrial policy The huge producing capacity of China’s wire & cable manufacturing
was officially implemented. The new policy clearly limited up the industry has brought great attention to the whole world. With
seriously excessive capacity of the industry, which made the policy the continuous expanding of China’s power industry, data communi
more conformed to the the supporting industries’ development need in cation industry, metropolitan rail transportation industry, automobile
the direction of industrial development, thus to give clear direction industry and shipbuilding industry, demand for wire & cable will
to excess production capacity. also be grow rapidly. In future, there will be huge potentiality for
Figure 3 2012-2016 China’s Wire & Cable capacity development of wire and cable industry.
Figure 5 Statistic analysis of China’s power cable production rate
In 2016, China’s power cable production reached 55.703 million, whose
year-on-year increase leveled up 32.8%. Since 2010, the output of
China’s power cable revealed the tendency of nonstop increasing. In
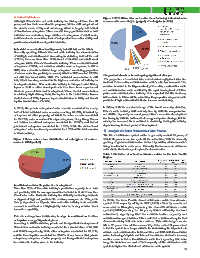
4. Regional market share 2012, the output of China’s power cables was 40.197 million kilometers,
According to the statistics, in 2016, East China’s sales volume takes with high growth rate of 30%. Power cable production will continue its
the largest share of wire and cable industry, accounting for more than tendency of increasing for the next few years.
half of the total industrial sales revenue, up to 63.77%. The second
largest share was Southern China, with its sales revenue share of 11.97% Table 1 2016 China’s power cable production rate of each
among the whole industry. The wire and cable industrial sales revenue province or city
of other areas are all less than 10%. District
China 5570.37
Figure 4 2016 Sales value share in various districts (unit: %) Beijing 14.92 0.27%
Tianjin 525.71 9.44%
Hebei 290.32 5.21%
Shanxi 8.67 0.16%
Mongolia 9.09 0.16%
Liaoning 198.84 3.57%
Jilin 43.64 0.78%
Heilongjiang 14.05 0.25%
Shanghai 176.79 3.17%
Jiangsu 1073.06 19.26%
Zhejiang 383.16 6.88%
Anhui 400.71 7.19%
Fujian 31.61 0.57%
Jiangxi 75.64 1.36%
Shandong 302.77 5.44%
Henan 128.84 2.31%
5. Production rate of country and provinces (power cables) Hubei 63.36 1.14%
Power cables are cables used to transmit and distribute electrical energy. Hunan 342.78 6.15%
Power cables are commonly used in urban underground power grids, Guangdong 863.26 15.50%
power stations, lead out lines, internal power supply of industrial and Guangxi 188.27 3.38%
mining enterprises, and transmission line of sea water across rivers. In Hainan 13.76 0.25%
the power line, the proportion of the cable is increasing gradually. Power Chongqing 145.91 2.62%
cable is a kind of cable product used to transmit and distribute high Sichuan 171.03 3.07%
power electric energy in the main circuit of power system, including Guizhou 24.5 0.44%
1-500KV and all kinds of voltage level, all kinds of insulated power Yunnan 17.34 0.31%
cables. Xizang - -
Shanxi 4.14 0.07%
Wire and cable industry is the secondary largest industry in China Gansu 28.61 0.51%
after the automotive industry. The product variety satisfaction rate Qinghai 2.57 0.05%
and the domestic market share rate are all over 90%. In the world, the Ningxia 10.34 0.19%
total production value of China’s wire and cable has already surpasse Xinjiang 16.66 0.30%
d USA, becoming of global largest manufacturing country of wire and
cable. With the rapid development of China's wire and cable industry, According to the above table of statistics, it can be concluded that the
the number of new enterprises is increasing, and the overall technical output of power cables in Jiangsu, Zhejiang and Shanghai district in
level of the industry has been largely improved. 2016 was 16.33 million kilometers, accounting for 29.31% of the total
output of china.
26