
Page 24 - 2016年线缆竞争力报告(摘要版)
P. 24
《2016年中国线缆行业最具竞争力企业10强》竞争力报告(摘要版)21
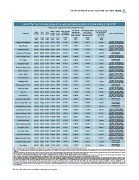
List of "the Top 100 enterprises in the wire and cable industry of China during 2015-2016"
Standard value weighted of the financial data(70% weight)
Return Return Sales revenues The ratio of The average growth The average growth
on total on net contribution rate of net profit
Company Sales Net Net assets assets per employee international rate of sales for the last Source of financial data
revenues assets profit three years
Jiangsu Shuangdeng revenue to total revenues for the Taxationǃresearch ˂ survey
Anhui Pacific information˗self-reported figures
sales revenues last three years and grid companies' tender results
Zhejiang Hongbo
Guangdong Huasheng weight weight weight weight weight weight weight weight weight Taxationǃresearch ˂ survey
Hebei Yongjin Cable 18% 13% 13% 8% 8% 5% 6% 14% 15% information˗self-reported figures
and grid companies' tender results
LCE-Optics 0.0299 -0.0311 -0.0011 0.0130 -0.0078 0.0669 -0.0016 0.0025 0.0092
Shanghai Panda Taxationǃresearch ˂ survey
Sichuan Chndo Cable -0.0042 -0.0247 0.0011 0.0251 -0.0041 0.0148 -0.0026 0.0252 0.0468 information˗self-reported figures
Hebei Tianhuan and grid companies' tender results
0.0565 -0.0148 -0.0009 -0.0536 -0.0169 0.1123 -0.0026 -0.0036 0.0002
Saide Electric Annual report of
Hebei Wanfang 0.0591 0.0070 -0.0010 0.0008 -0.0111 0.0338 -0.0006 -0.0088 -0.0116 listed company
Huaxing Cable Taxationǃresearch ˂ survey
0.0022 -0.0068 -0.0008 0.0034 -0.0066 0.0652 -0.0026 -0.0028 -0.0033 information˗self-reported figures
and grid companies' tender results
-0.0253 -0.0112 -0.0023 0.0524 0.0333 -0.0171 -0.0026 0.0119 0.0040 Annual report of
listed company
-0.0035 -0.0310 -0.0013 0.0147 -0.0093 0.0743 -0.0026 -0.0051 0.0044 Taxationǃresearch ˂ survey
information˗self-reported figures
0.0433 -0.0333 -0.0022 0.0040 0.0087 0.0153 -0.0021 -0.0073 -0.0062 and grid companies' tender results
Taxationǃresearch ˂ survey
-0.0048 -0.0226 -0.0005 0.0008 -0.0120 0.0406 -0.0026 0.0114 0.0091 information˗self-reported figures
and grid companies' tender results
0.0058 -0.0205 -0.0011 0.0193 -0.0070 0.0218 0.0015 -0.0010 -0.0024 Taxationǃresearch ˂ survey
information˗self-reported figures
0.0031 -0.0264 -0.0016 -0.0318 -0.0142 0.0795 -0.0026 0.0014 0.0042 and grid companies' tender results
Taxationǃresearch ˂ survey
-0.0147 -0.0183 -0.0016 0.0098 -0.0091 0.0670 -0.0026 -0.0074 -0.0147 information˗self-reported figures
and grid companies' tender results
Taxationǃresearch ˂ survey
information˗self-reported figures
and grid companies' tender results
Taxationǃresearch ˂ survey
information˗self-reported figures
and grid companies' tender results
Shengyang Sci-Tech -0.0326 -0.0219 -0.0009 0.0172 -0.0001 0.0035 0.0536 -0.0124 -0.0123 Annual report of
Kunming Cable 0.0918 -0.0126 -0.0019 -0.0690 -0.0106 0.0301 -0.0026 -0.0094 -0.0217 listed company
Xi'an XD 0.0856 -0.0336 -0.0026 -0.1035 -0.0261 0.0300 -0.0026 -0.0002 0.0461
Hebei Jinqiao -0.0031 -0.0383 -0.0021 -0.0272 -0.0143 0.0684 -0.0026 0.0015 0.0002 Taxationǃresearch ˂ survey
-0.0137 -0.0065 -0.0028 -0.0846 -0.0434 0.1183 0.0038 0.0069 -0.0037 information˗self-reported figures
Jingwei Electric Wire and grid companies' tender results
Taxationǃresearch ˂ survey
information˗self-reported figures
and grid companies' tender results
Taxationǃresearch ˂ survey
information˗self-reported figures
and grid companies' tender results
Annual report of
listed company
Ronsen Super Micro-wire 0.0284 -0.0282 -0.0026 -0.0787 -0.0344 0.0101 0.0127 -0.0078 0.0665 Annual report of
0.0633 -0.0026 -0.0066 0.0349 listed company
Shanghai Morn Electric -0.0348 -0.0001 -0.0021 -0.0699 -0.0171 0.0040 -0.0026 -0.0160 0.0201
-0.0012 -0.0024 -0.0092 0.0376 Annual report of
Guangdong Ltk Cable 0.0397 -0.0383 -0.0015 -0.0284 -0.0174 -0.0174 0.0057 0.0020 0.0212 listed company
0.0439 -0.0026 -0.0096 -0.0003
Jiaozuo Railway Cable -0.0039 -0.0343 -0.0019 -0.0297 -0.0119 0.0263 -0.0026 -0.0090 -0.0240 Taxationǃresearch ˂ survey
0.0679 -0.0026 -0.0063 0.0014 information˗self-reported figures
Guangdong Ltk Cable 0.0051 -0.0264 -0.0013 -0.0260 -0.0208 0.0262 -0.0026 -0.0012 -0.0123 and grid companies' tender results
0.0653 -0.0026 0.0004 0.0036
Valin Wire&Cable 0.0159 -0.0176 -0.0022 -0.0683 -0.0257 0.0056 -0.0026 0.0029 0.0421 Taxationǃresearch ˂ survey
-0.0114 -0.0026 0.0210 -0.1442 information˗self-reported figures
NARI Huaisheng Cable 0.0764 -0.0399 -0.0027 -0.1069 -0.0124 and grid companies' tender results
Zhonglan Group 0.0130 -0.0252 -0.0029 -0.1032 -0.0450 Taxationǃresearch ˂ survey
information˗self-reported figures
Joy Sense Cable -0.0198 -0.0299 -0.0017 -0.0389 -0.0230 and grid companies' tender results
Oriental Crosslinked -0.0190 -0.0426 -0.0022 -0.0813 -0.0322 Taxationǃresearch ˂ survey
information˗self-reported figures
Ming Da Electric Cable -0.0241 -0.0302 -0.0030 -0.1128 -0.0496 and grid companies' tender results
Chengdu Putian Cable 0.0804 0.0457 -0.0071 -0.1244 -0.0574 Taxationǃresearch ˂ survey
information˗self-reported figures
and grid companies' tender results
Taxationǃresearch ˂ survey
information˗self-reported figures
and grid companies' tender results
Taxationǃresearch ˂ survey
information˗self-reported figures
and grid companies' tender results
Taxationǃresearch ˂ survey
information˗self-reported figures
and grid companies' tender results
Taxationǃresearch ˂ survey
information˗self-reported figures
and grid companies' tender results
Annual report of
listed company
Star Cable 0.0032 0.0607 -0.0052 -0.1118 -0.0533 -0.0015 -0.0026 -0.0174 -0.2954 Annual report of
listed company
Note 1: Enterprises qualified for the competitiveness selection in the wire and cable industry of China shall have 2 or more items of relevant products as core businesses.
Note 2: For sales revenues and net profit indicator, due to enterprises’ sales revenues from diversified products revenues, the data we collect is based on the revenues of relevant products of wire and cable business and net profits of relevant wire and cable
products. The net profit rate will be calculated by relevant products contribution rate in sales revenues, if the enterprise listed does not reveal net profit of relevant products in its annual report. Net asset data is collected from the wire and cable group of the
enterprise.
Note 3: As for the other six indicators (of return on net assets, return on total assets, sales revenues contribution per employee, the ratio of international revenue to total sales revenues, the average growth rate of sales revenues for the last three years and the
average growth rate of net profit for the last three years), we refer to the released annual reports of the enterprises listed in the rankings, and make no more in subdivision.
Note 4: Return on net assets can be defined in different formula. To avoid the incomparable problem of net profit caused by the different corporate income tax rate in listed companies and unlisted companies, we define the molecular in the formula as net profit
before tax instead of net profits. The formula of calculating return on net assets is: Return on net assets=net profit before tax/ net assets; Return on total assets=Net profits before tax/ total assets.
Note 5: From the monitoring data, it is found that if the enterprise competitiveness comes mainly from the increase indicators (that is, the average growth rate of revenues for the last three years & the average growth rate of net profit for the last th ree years),
the monitoring data of the enterprise competitiveness is usually unstable. The main reason for the enterprise competitiveness instability is that the original sales revenues base in these enterprises was small and the increasing sales revenues of recent 2 years
make the average growth rate of the past 3 years far higher than the industry average level. The extremely high standard value of a certain indicator in the company may cause the standard value of financial data competitiveness index over high on the whole.
But in the second or third years, when the growth rate of sales revenues drops to the normal average level and instead there is no higher growth in the other indicators, the monitoring index of the enterprise competitiveness will decline significantly. To avoid
the impact of abnormal change in financial indicators on the objectivity of the enterprise competitiveness evaluation, we find a practical way to improve it. That is, we set the upper and low limit of standard value in the increase indicators (the average growth
rate of revenues for the last three years & the average growth rate of net profit for the last three years) within [-1,1]. With the consistency of statistical test, the overdone impact on overall standard value of financial data by the abnormal data of growth index
can be eliminated.
The top 100 enterprises are listed randomly by computer