
Page 6 - Analysis Report of Global Market in the Submarine Cable Field (2017)
P. 6
Wire and Cable
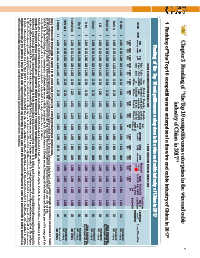
Country Italy Finland Switzerland Japan USA Switzerland China Korea China China
Ranking of "the Top 10 competitiveness enterprises in the submarine cable field of global market in 2017
Source of financial data Annual report of listed company Annual report of listed company Annual report of listed company Annual report of listed company Annual report of listed company Annual report of listed company Annual report of listed company Annual report of listed company Annual report of listed company Annual report of listed company
op 10 competitiveness enterprises in the submarine cable
Comprehensive score of competitiveness 1000 975 957 926 917 900 891 870 866 803
Ranking of the Top 10 competitiveness enterprises in the submarine cable field of global market in 2017
Comprehensive index of competitiveness $ % 2.9254 2.5657 2.2829 1.7919 1.6931 1.3944 1.2977 0.9962 0.9326 0.0503
Total standard Industry value weighted Contribution of the survey data % weight 20% 2.8947 0.6084 2.6699 0.4935 2.5987 0.6173 2.2173 0.5152 2.3194 0.4214 2.3201 0.4536 2.1387 0.4137 2.0999 0.4731 2.2298 0.5645 1.6459 0.3766
Standard value weighted of the survey data(30% weight) Management Brand level of awareness enterprise weight weight 20% 10% 0.3147 0.6360 0.4212 0.5325 0.4291 0.4867 0.3712 0.3359 0.3880 0.3884 0.4153 0.3730 0.3270 0.3765 0.2630 0.2904 0.4930 0.3587 0.2061 0.2821
field of global market in 2017"
Technology Product Quality innovation weight weight 20% 30% 0.5014 0.8342 0.5875 0.6352 0.4842 0.5814 0.3228 0.6722 0.3512 0.7704 0.4190 0.6592 0.3760 0.6455 0.3044 0.7690 0.4075 0.4061 0.3862 0.3949 Note 2: For sales revenues and net profit indicator, due to enterprises’ sales revenues from diversified products revenues, the data we collect is based on the revenues of relevant products of wire and cable bus
Total standard value weighted of the financial data $ 2.9386 2.5210 2.1475 1.6096 1.4247 0.9976 0.9373 0.5232 0.3766 -0.6335
The average The average growth rate growth rate of of net profit sales revenues for the last for the last three years three years weight weight 15% 14% 0.0208 -0.0024 0.0019 0.0015 0.0110 -0.0027 0.0274 -0.0381 0.0119 -0.0100 0.0169 -0.0019 0.0326 0.0399 0.0892 -0.0175 0.0585 0.0245 -0.0177 0.0050 calculated by relevant products contribution rate in sales revenues, if the enterprise listed does not r
Chapter 1 Ranking of "the T
Standard value weighted of the financial data(70% weight) The ratio of Sales international revenues Return revenue contribution on net to total sales per assets revenues employee weight weight weight 6% 5% 8% 0.0496 0.0812 0.0798 0.0582 0.0262 0.0389 0.0394 -0.0021 0.0325 0.0106 0.0327 0.0065 0.0517 0.0226 0.0352 -0.0284 0.0030 0.0546 0.0438 0.0277 -0.0504 0.0034 0.0036 0.1051 0.0006 0.
Net Return on total profit assets weight weight 8% 13% 0.0566 0.9600 0.0984 0.0872 0.9515 0.0826 0.0720 0.7999 0.0775 0.0026 1.0092 0.0458 -0.0234 -0.0080 0.8325 0.0358 0.1478 0.7188 0.0403 0.0556 0.0133 0.1220 -0.0334 -0.0171 0.2803 0.0108 0.1180 -0.6763 -0.0036 0.0003 -0.0008 -0.0049 impact on overall standard value of financial data by the abnormal data of growth index can be eliminated.
Net assets weight 13% -0.3830 0.9468 0.0777 -0.5618 0.5443 0.0809
Sales revenues weight 18% 1.5946 1.2732 1.1200 0.5129 0.5116 0.2337
Ranking 1 2 3 4 5 6 7 8 9 10
Company Prysmian Nokia Alcatel-Lucent TE NEC Nexans NKTčABBĎ ZTT LS Cable Hengtong Ningbo Orient Cable
6