
Page 8 - Analysis Report of Global Market in the Submarine Cable Field (2017)
P. 8
Wire and Cable
Source of financial data Annual report of listed company Annual report of listed company Taxationǃresearch ˂ survey information˗self-reported figures and grid companies' tender results Annual report of listed company Annual report of listed company Taxationǃresearch ˂ survey information˗self-reported figures and grid companies' tender results Annual report of listed company Annual report of listed company Annual report of listed compa
op 20 competitiveness enterprises in the wire and cable
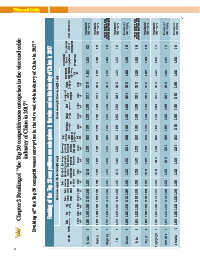
Ranking of "the Top 20 competitiveness enterprises in the wire and cable industry of China in 2017"
Comprehensive score of competitiveness 1000 990 979 978 969 963 962 956 952 951
Ranking of the Top 20 competitiveness enterprises in the wire and cable industry of China in 2017
Comprehensive index of competitiveness $ % 2.7041 2.4921 2.2246 2.2209 1.9465 1.7256 1.7249 1.4573 1.3483 1.3432
Total standard Industry value weighted Contribution of the survey data % weight 20% 2.8640 0.5068 2.8663 0.4188 2.8666 0.4390 2.2230 0.4132 2.3623 0.3960 2.2262 0.5255 2.2265 0.3520 2.2268 0.4537 2.4776 0.3604 2.5162 0.4787
Standard value weighted of the survey data(30% weight) Management Brand level of awareness enterprise weight weight 20% 10% 0.6450 0.5828 0.5652 0.6461 0.6037 0.6372 0.4768 0.3424 0.5345 0.5758 0.5851 0.2077 0.5154 0.3962 0.5365 0.4181 0.5362 0.4547 0.5796 0.4791
industry of China in 2017"
Technology Product Quality innovation weight weight 20% 30% 0.5007 0.6287 0.5823 0.6539 0.5289 0.6578 0.4890 0.5016 0.4232 0.4328 0.4132 0.4947 0.3792 0.5837 0.3872 0.4313 0.5079 0.6184 0.4827 0.4961
Total standard value weighted of the financial data $ 2.6356 2.3318 1.9495 2.2199 1.7683 1.5110 1.5099 1.1275 0.8643 0.8404
The average The average growth rate growth rate of of net profit sales revenues for the last for the last three years three years weight weight 15% 14% 0.0157 0.1400 0.0096 0.1400 0.0003 0.1397 0.0090 0.1400 -0.0012 0.1400 0.0005 0.1400 0.0004 0.1400 0.0047 -0.1400 -0.0007 -0.1400 -0.0053 0.1213
Chapter 2 Ranking of "the T
Standard value weighted of the financial data(70% weight) The ratio of Sales international revenues Return revenue contribution on net to total sales per assets revenues employee weight weight weight 6% 5% 8% 0.0035 0.0121 -0.0006 0.0599 -0.0005 0.0603 0.0032 0.0343 -0.0001 0.0437 -0.0019 0.0312 0.0132 0.0133 0.0014 0.0526 -0.0005 0.0206 -0.0026 -0.0161
Net Return on total profit assets weight weight 8% 13% 1.6984 0.4182 0.0566 0.0472 0.2439 1.7818 0.2717 0.0223 -0.0002 0.0473 1.3035 0.2878 0.0318 0.0559 0.0707 1.3595 0.4507 0.0533 0.0488 0.1211 1.0815 0.3504 0.0479 0.0227 0.0834 0.8241 0.3009 0.0352 0.0339 0.1471 0.7730 0.3788 0.0233 0.0378 0.1302 0.9128 0.1700 0.0122 0.0335 0.0803 0.4999 0.3353 0.0399 0.0384 0.0714 0.6146
Net assets weight 13%
Sales revenues weight 18%
Ranking 1 2 3 4 5 6 7 8 9 10
Company Hengtong Baosheng Shangshang ZTT Jiangnan Futong Zhongli Tongling Jingda Hanhe Cable Zhongchao
8