Page 7 - Analysis Report of Global Market in the Submarine Cable Field (2017)
P. 7

ZTT
                                                      Futong
                                                  Zhongli
                                                                            Hengtong
                                                           Jiangnan
                                                                                       Company
                                                                        Baosheng
                                     Zhongchao
                                                                   Shangshang
                                         Hanhe Cable
                                             Tongling Jingda
                                                           5
                                                  7
                                                                            1
                                         9
                                             8
                                                      6
                                                               4
                                                                   3
                                                                        2
                                     10
                                                                                       Ranking
                                                                                18%
                                                                                        Sales
                                                                                  weight
                                                                                       revenues
                                                                                        Net
                                                                                13%
                                                                                       assets
                                                                                  weight
                                                                                        Net
                                                                                13%
                                                                                       profit
                                                                                  weight
                                                                                8%
                                                                                         Return
                                                                                      assets
                                                                                  weight
                                                                                       on total
                                                                                8%
                                                                                       on net
                                                                                      assets
                                                                                  weight
                                                                                         Return
                                              0.9128   0.1700  0.0122   0.0335   0.0803
                                                                1.3595   0.4507  0.0533   0.0488   0.1211
                                                                    1.3035   0.2878  0.0318   0.0559   0.0707
                                                                         1.7818   0.2717  0.0223  -0.0002  0.0473
                                      0.6146   0.0862  0.0030  -0.0082  0.0477
                                                                             1.6984   0.4182  0.0566   0.0472   0.2439
                                                   0.7730   0.3788  0.0233   0.0378   0.1302
                                          0.4999   0.3353  0.0399   0.0384   0.0714
                                                       0.8241   0.3009  0.0352   0.0339   0.1471
                                                            1.0815   0.3504  0.0479   0.0227   0.0834
                                                                                      per
                                                                                5%
                                                                                          Sales
                                                                                  weight
                                                                                         revenues
                                                   0.0133
                                                       0.0312
                                                                         0.0599
                                                            0.0437
                                              0.0526
                                          0.0206
                                                                0.0343
                                                                    0.0603
                                                                                    employee
                                                                             0.0121
                                      -0.0161
                                                                                       contribution
                                                                                6%
                                                                                  weight
                                                                                        revenue
                                                                                    revenues
                                                                             0.0035
                                                                0.0032
                                              0.0014
                                                   0.0132
                                          -0.0005
                                                       -0.0019
                                      -0.0026
                                                                         -0.0006
                                                            -0.0001
                                                                                          The ratio of
                                                                    -0.0005
                                                                                         international
                                                                                      to total sales
                                                                                14%
                                                                                  weight
                                                                                                                  Chapter 2  Ranking of  "the T
                                                                         0.1400
                                                                                             Standard value weighted of the financial data(70% weight)
                                                                    0.1397
                                                                             0.1400
                                                                0.1400
                                                            0.1400
                                                                                      for the last
                                      0.1213
                                                   0.1400
                                                       0.1400
                                          -0.1400
                                              -0.1400
                                                                                     three years
                                                                                          The average
                                                                                         growth rate of
                                                                                       sales revenues
                                                                                15%
                                                                                  weight
                                                                    0.0003
                                                                0.0090
                                                   0.0004
                                              0.0047
                                                                             0.0157
                                                                         0.0096
                                                       0.0005
                                      -0.0053
                                          -0.0007
                                                                                      for the last
                                                            -0.0012
                                                                                       of net profit
                                                                                    three years
                                                                                         growth rate
                                                                                          The average
                                                                                 $
                                                                                  data
                                                                                       value
                                                                                          Total
                                                                                        standard
                                              1.1275
                                          0.8643
                                                                             2.6356
                                      0.8404
                                                                    1.9495
                                                       1.5110
                                                                         2.3318
                                                            1.7683
                                                   1.5099
                                                                2.2199
                                                                                     weighted of
                                                                                   the financial
                                                                                30%
                                                                                  weight
                                     0.4961
                          of net profit for the last three years), we refer to the released annual reports of the enterprises listed in the rankings, and make no more in subdivision.
                                                      0.4947
                                                                   0.6578
                                             0.4313
                                                                                       innovation
                                                                        0.6539
                                                  0.5837
                                                                            0.6287
                                                               0.5016
                                         0.6184
                                                           0.4328
                                                                                        Technology
            With the consistency of statistical test, the overdone impact on overall standard value of financial data by the abnormal data of growth index can be eliminated.
                                                                                20%
                                                                                  weight
                                                                                       Quality
                                                                                        Product
                                     0.4827
                                                                        0.5823
                                                           0.4232
                                                                   0.5289
                                             0.3872
                                                                            0.5007
                                                  0.3792
                                                               0.4890
                                                      0.4132
                                         0.5079
                                 Note 1: Enterprises qualified for the competitiveness selection in the wire and cable industry of China shall have 2 or more items of relevant products as core businesses.
                       net profits. The formula of calculating return on net assets is: Return on net assets=net profit before tax/ net assets; Return on total assets=Net profits before tax/ total assets.
                                                                                10%
                                                                                  weight
                                                                                        Brand
                                     0.4791
                                                                   0.6372
                                                                            0.5828
                                                      0.2077
                                                  0.3962
                                         0.4547
                                                               0.3424
                                                                        0.6461
                                             0.4181
                                                           0.5758
                                                                                       awareness
                                                                                                              industry of China  in 2017"
                                                                                20%
                                                                                  weight
                                                                                       level of
                                     0.5796
                                                      0.5851
                                         0.5362
                                                           0.5345
                                                  0.5154
                                                                            0.6450
                                                               0.4768
                                                                        0.5652
                                              0.5365
                                                                   0.6037
                                                                                      enterprise
                                                                                         Management
                                                                                20%
                                                                                  weight
                                     0.4787
                                                                                        Industry
                                                               0.4132
                                              0.4537
                                                                            0.5068
                                                                        0.4188
                                                           0.3960
                                                                   0.4390
                                                      0.5255
                                         0.3604
                                                  0.3520
                                                                                       Contribution
                                                                                             Standard value weighted of the survey data(30% weight)
                                                                                   %
                                                                                    data
                                                                        2.8663
                                                                            2.8640
                                                           2.3623
                                                  2.2265
                                     2.5162
                                         2.4776
                                                                   2.8666
                                                      2.2262
                                              2.2268
                                                               2.2230
                                                                                     of the survey
                                                                                        Total standard
                                                                                       value weighted
                                                                                        index of
                                                                            2.7041
                                                                   2.2246
                                                      1.7256
                                     1.3432
                                                               2.2209
                                                                        2.4921
                                                           1.9465
                                              1.4573
                                                  1.7249
                                         1.3483
                                                                                    $     %
                                                                                          Comprehensive
                                                                                      competitiveness
                              rate will be calculated by relevant products contribution rate in sales revenues, if the enterprise listed does not reveal net profit of relevant products in its annual report. Net asset data is collected from the wire and cable group of the enterprise.
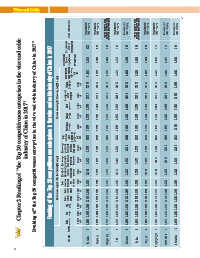
                                                                                                 Ranking of  the Top 10 competitiveness enterprises in the wire and cable industry of China in 2017
                                                                   979
                                                      963
                                         952
                                              956
                                                  962
                                     951
                                                                        990
                                                               978
                                                           969
                                                                            1000
                                                                                       score of
                                                                                        Comprehensive
                                                                                     competitiveness
                                                                                                                  op 10 competitiveness enterprises in the wire and cable
                                                                                                        1. Ranking of "the Top 10 competitiveness enterprises in the wire and cable industry of China in 2017"
                                                 listed company
                                             listed company
                                    listed company
                                                                            listed company
                                        listed company
                                                          listed company
                                                              listed company
                                                                       listed company
                                                                         Annual report of
                                               Annual report of
                                                                             Annual report of
                                                   Annual report of
                                      Annual report of
                                                                Annual report of
                                          Annual report of
                                                           Annual report of
                                                                                       Source of financial data
                                                                    Taxationǃresearch ˂ survey
                                                       Taxationǃresearch ˂ survey
                                                                   information˗self-reported figures
                                                      information˗self-reported figures
                                                                  and grid companies' tender results
                                                     and grid companies' tender results
                                Note 2: For sales revenues and net profit indicator, due to enterprises’ sales revenues from diversified products revenues, the data we collect is based on the revenues of relevant products of wire and cable business and net profits of relevant wire and cable products. The net profit
                            Note 3: As for the other six indicators (of return on net assets, return on total assets, sales revenues contribution per employee, the ratio of international revenue to total sales revenues, the average growth rate of sales revenues for the last three years and the average growth rate
                drops to the normal average level and instead there is no higher growth in the other indicators, the monitoring index of the enterprise competitiveness will decline significantly. To avoid the impact of abnormal change in financial indicators on the objectivity of the enterprise
                   enterprise competitiveness is usually unstable. The main reason for the enterprise competitiveness instability is that the original sales revenues base in these enterprises was small and the increasing sales revenues of recent 2 years make the average growth rate of the past 3 years
              competitiveness evaluation, we find a practical way to improve it. That is, we set the upper and low limit of standard value in the increase indicators (the average growth rate of revenues for the last three years & the average growth rate of net profit for the last three years) within [-1,1].
                         Note 4: Return on net assets can be defined in different formula. To avoid the incomparable problem of net profit caused by the different corporate income tax rate in listed companies and unlisted companies, we define the molecular in the formula as net profit before tax instead of
                     Note 5: From the monitoring data, it is found that if the enterprise competitiveness comes mainly from the increase indicators (that is, the average growth rate of revenues for the last three years & the average growth rate of net profit for the last three years), the monitoring data of the
                  far higher than the industry average level. The extremely high standard value of a certain indicator in the company may cause the standard value of financial data competitiveness index over high on the whole. But in the second or third years, when the growth rate of sales revenues
                                                                                                                    7
   2   3   4   5   6   7   8   9   10   11   12