
Page 41 - 2016年线缆竞争力报告(摘要版)
P. 41
38 The competitiveness report on "the Top 10 competitiveness enterprises in the wire and cable industry of China in 2016" (Abstract Edition)
Chapter 2 The indicator system and data process of "the Top 10
competitiveness enterprises in the wire and cable industry
during 2015-2016"
(Omitted due to commercial confidential)
Chapter 3 Analysis report of “The Impacts Chinese Wire and Cable
Enterprises’ Cost on Enterprise Competitiveness”
(Omitted due to commercial confidential)
Chapter 4 Figure interpretation for enterprises strength: the analysis of the
monitor results in financial data
Section 1 The comprehensive evaluation of enterprise competitiveness in the wire
and cable industry of China during 2015-2016
………… 【Please refer to "The competitiveness report on 'the Top 10 competitiveness enterprises in the wire and cable
industry of China during 2015-2016'(integrated edition)" for details】
Section 2 Competitiveness analysis of "the Top 10 competitiveness enterprises
in the wire and cable industry of China"
Hard indicator of relevant financial data in the top 10 competitiveness enterprises in the wire and cable industry of China in
2016 are divided to the scale sub-factors, efficiency sub-factors and growth sub-factors. In order to make it easier for analysis and
comparison, we make the following tables and charts.
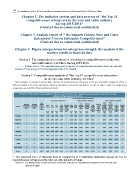
Table4-2-1 The standard value weighted of financial data of the top 10 competitiveness enterprises in the wire and cable
industry of China during 2015-2016
The standard value weighted of financial data
Scale sub-factors˄weight 44%˅ Efficiency sub-factors˄weight 27%˅ Increase sub-factors˄weight 29%˅
Total Sales The ratio of The The
revenues average average
Ranking of Ranking of standard Total Ranking of Return Return contribution international Total Ranking of growth rate growth rate Total Ranking of
on net standard of sales standard standard
Company comprehensive financial data value Sales Net Net standard standard on total assets per revenue standard revenues of net
revenues assets profit employee value for the last profit value value
competitiveness competitiveness weighted of value value assets weight to total sales value weighted three years for the last weighted weighted
weight 8% weight three years of increase of increase
index index the 13% weighted weighted revenues weighted of weight
efficiency 14% weight index index
financial of scale of scale of efficiency 15%
index
weight weight index index weight weight index
18% 13%
8% 5% 6%
Hengtong 1 1 2.5965 1.8408 0.3965 0.0585 2.2958 1 0.0947 0.1437 0.0412 0.0014 0.2809 5 0.0085 0.0113 0.0197 7
Shangshang 2 2 2.0445 1.3706 0.1994 0.0278 1.5978 3 0.2509 0.0737 0.1279 -0.0008 0.4517 1 -0.0042 -0.0008 -0.0050 24
Baosheng 3 3 1.8952 1.6473 0.1135 0.0123 1.7731 2 -0.0314 0.0470 0.0947 -0.0001 0.1102 23 0.0047 0.0073 0.0119 13
ZTT 4 5 1.7021 1.0498 0.2336 0.0379 1.3214 5 0.1956 0.0765 0.0671 0.0075 0.3467 4 0.0215 0.0126 0.0341 3
Jiangnan 5 4 1.8950 1.0825 0.3199 0.0638 1.4662 4 0.1747 0.1451 0.0901 -0.0007 0.4092 3 0.0079 0.0116 0.0196 8
Hanhe Cable 6 6 1.0920 0.4894 0.2829 0.0293 0.8016 8 0.1675 0.0709 0.0447 -0.0013 0.2819 9 -0.0024 0.0110 0.0086 14
Zhongli 7 7 1.0917 0.5861 0.2939 0.0332 0.9131 6 0.0025 0.1061 0.0495 0.0061 0.1641 17 0.0113 0.0032 0.0144 11
Futong 8 8 1.0590 0.5115 0.2373 0.0352 0.7840 9 0.1357 0.0653 0.0637 -0.0019 0.2627 7 0.0110 0.0012 0.0122 12
Tongling Jingda 9 9 1.0334 0.7020 0.1584 0.0046 0.8651 7 0.0553 0.0217 0.0994 0.0015 0.1778 13 -0.0067 -0.0028 -0.0096 26
Wanma 10 10 0.9487 0.4902 0.1719 0.0219 0.6840 10 0.1361 0.0645 0.0522 -0.0026 0.2501 10 0.0090 0.0056 0.0146 10
1 The standard value of financial data in comparison of 9 individual indicators among the top 10
competitiveness enterprises in the wire and cable industry of China
Chart 4-2-1 The standard value of sales revenues in comparison of the top 10 competitiveness enterprises in the wire and cable
industry of China