
Page 17 - Analysis Report of Global Market in the Submarine Cable Field (2017)
P. 17
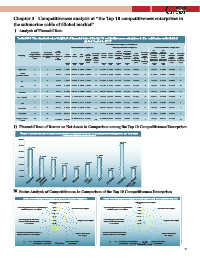
Chapter 3   Competitiveness analysis of “the Top 10 competitiveness enterprises in
         the submarine cable of Global market”

         Ⅰ Analysis of Financial Data

            Table5-2-1 The standard value weighted of financial data of the top 10 competitiveness enterprises in the  submarine cable field of
                                                      global market in 2017
                                                                  The standard value weighted of financial data
                                             Scale sub-factors˄weight 44%˅  Efficiency sub-factors˄weight 27%˅  Increase sub-factors˄weight 29%˅
                                    Total                                                       The   The
                    Ranking of  Ranking of  standard                     Sales  The ratio of  Ranking of  average  average
                   comprehensive  financial data  value  Sales  Net  Net  Total  Ranking of  Return  Return  revenues  international  Total  standard  growth rate  growth rate  Total  Ranking of
            Company                                   standard  standard  on total  on net  contribution   revenue  standard  of sales  of net  standard  standard
                   competitiveness  competitiveness weighted of  revenues  assets  profit  assets  assets  per  to total sales  value   revenues  profit
                     index   index  the                value  value                  value  weighted       value  value
                                   financial          weighted weighted  employee  revenues  weighted  of  for the last  for the last  weighted  weighted
                                                      of scale  of scale           of efficiency  efficiency   three years  three years of increase of increase
                                         weight  weight  weight  index  index  weight  weight  weight  weight  index  index  weight  weight  index  index
                                          18%  13%  13%          8%  8%   5%   6%               14%  15%
            Prysmian   1      1     2.9386   1.5946  0.9600  0.0984  2.6530   1  0.0566  0.0798   0.0812   0.0496   0.2671   1  -0.0024   0.0208   0.0185   4
             Nokia
          čAlcatel-LucentĎ  2  2    2.5210   1.2732  0.9515  0.0826  2.3073   2  0.0872  0.0389   0.0262   0.0582   0.2105   4  0.0015   0.0019   0.0033   7
              TE      3       3     2.1475   1.1200  0.7999  0.0775  1.9974   3  0.0720  0.0325  -0.0021   0.0394   0.1417   5  -0.0027   0.0110   0.0084   6
              NEC     4       4     1.6096   0.5129  1.0092  0.0458  1.5679   4  0.0026  0.0065   0.0327   0.0106   0.0524   8  -0.0381   0.0274   -0.0107   10
             Nexans   5       5     1.4247   0.5116  0.8325  0.0358  1.3799   5  -0.0234  -0.0080  0.0226   0.0517   0.0429   9  -0.0100   0.0119   0.0019   8
           NKTčABBĎ   6       6     0.9976    0.1478   0.7188  0.0403  0.9069   6   0.0556   0.0133   -0.0284    0.0352   0.0756   6   -0.0019    0.0169   0.0150   5
              ZTT     7       7     0.9373   -0.3830  0.9468  0.0777  0.6415   7  0.1220  0.0438   0.0546   0.0030   0.2233   3  0.0399   0.0326   0.0724   2
            LS Cable   8      8     0.5232   0.2337  0.2803  0.0108  0.5247   8  -0.0334  -0.0171  -0.0504   0.0277   -0.0733   11  -0.0175   0.0892   0.0717   3
            Hengtong  9       9     0.3766   -0.5618  0.5443  0.0809  0.0633   9  0.1180  0.1051   0.0036   0.0034   0.2302   2  0.0245   0.0585   0.0831   1
           Ningbo Orient   10  10  -0.6335    -0.6763   -0.0036  0.0003  -0.6796   12   -0.0008  -0.0049   0.0639    0.0006   0.0589   7   0.0050    -0.0177   -0.0127   11
             Cable
          Ⅱ Financial Data of Return on Net Assets in Comparison among the Top 10 Competitiveness Enterprises


             Chart3-1 The financial data of return on net assets in comparison of the top 10 competitiveness enterprises in the  submarine
                                        cable field of global market in 2017


                  Prysmian  Nokia δAlcatel  TE  NEC  Nexans   NKT δABBε   ZTT  LS Cable  Hengtong  Ningbo Orient
                           -Lucentε
                                                                                   Cable
          Ⅲ Status Analysis of Competitiveness in Comparison of the Top 10 Competitiveness Enterprises

                Chart3-2 The competitiveness analysis of Prysmian in comparison during 2017  Chart3-3 The competitiveness analysis of Nokia Alcatel-LucentĎin comparison during 2017
                                sales revenues˄18% weight˅                           sales revenues˄18% weight˅
                                  2.0000                                               2.0000
            The average growth rate of net profit for the  1.5000  The average growth rate of net profit for the  1.5000
               last three years˄15% weight˅   net assets˄13% weight˅  last three years˄15% weight˅  net assets˄13% weight˅
                                  1.0000                                               1.0000
                                  0.5000                                               0.5000
                                  0.0000                                               0.0000
            The average growth rate of sales                     The average growth rate of sales
            revenues for the last three years  -0.5000  net profit˄13% weight˅  revenues for the last three years  -0.5000  net profit˄13% weight˅
                ˄14% weight˅     -1.0000                             ˄14% weight˅     -1.0000

           The ratio of international revenues to  return on total assets  The ratio of international revenues to  return on total assets
            total sales revenues˄6% weight˅                      total sales revenues˄6% weight˅
                                                  ˄8% weight˅                                          ˄8% weight˅
                figures of 2017 sales revenues contribution  return on net assets  figures of 2017 sales revenues contribution  Nokia  return on net assets
                      per employee˄5% weight˅  Prysmian  ˄8% weight˅       per employee˄5% weight˅  ˄8% weight˅
                                                                                      čAlcatel-LucentĎ
                                                                                                                    17