
Page 18 - Analysis Report of Global Market in the Submarine Cable Field (2017)
P. 18
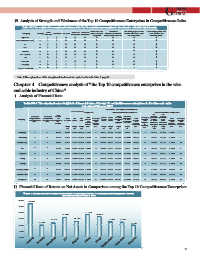
Wire and Cable


                 Chart3-4 The competitiveness analysis of TE in comparison during 2017  Chart3-5 The competitiveness analysis of NEC in comparison during 2017
                                 sales revenues˄18% weight˅                            sales revenues˄18% weight˅
                                  2.0000                                                 2.0000
            The average growth rate of net profit for the  1.5000  The average growth rate of net profit for the  1.5000
               last three years˄15% weight˅    net assets˄13% weight˅  last three years˄15% weight˅   net assets˄13% weight˅
                                  1.0000                                                 1.0000
                                  0.5000                                                 0.5000
                                  0.0000                                                 0.0000
            The average growth rate of sales                       The average growth rate of sales
            revenues for the last three years  -0.5000  net profit˄13% weight˅  revenues for the last three years  -0.5000  net profit˄13% weight˅
                ˄14% weight˅                                          ˄14% weight˅
                                  -1.0000                                               -1.0000
           The ratio of international revenues to  return on total assets  The ratio of international revenues to  return on total assets
            total sales revenues˄6% weight˅                       total sales revenues˄6% weight˅
                                                   ˄8% weight˅                                           ˄8% weight˅
                figures of 2017 sales revenues contribution  return on net assets  figures of 2017 sales revenues contribution  return on net assets
                      per employee˄5% weight˅  TE  ˄8% weight˅              per employee˄5% weight˅  NEC  ˄8% weight˅

                Chart3-6 The competitiveness analysis of Nexans in comparison during 2017  Chart3-7 The competitiveness analysis of  NKT ABB  in comparison during 2017
                                 sales revenues˄18% weight˅                            sales revenues˄18% weight˅
                                  2.0000                                                 2.0000
            The average growth rate of net profit for the  1.5000  The average growth rate of net profit for the  1.5000
               last three years˄15% weight˅    net assets˄13% weight˅  last three years˄15% weight˅   net assets˄13% weight˅
                                  1.0000                                                 1.0000
                                  0.5000                                                 0.5000
                                  0.0000                                                 0.0000
            The average growth rate of sales                       The average growth rate of sales
            revenues for the last three years  -0.5000  net profit˄13% weight˅  revenues for the last three years  -0.5000  net profit˄13% weight˅
                ˄14% weight˅                                          ˄14% weight˅
                                  -1.0000                                               -1.0000
           The ratio of international revenues to  return on total assets  The ratio of international revenues to  return on total assets
            total sales revenues˄6% weight˅                       total sales revenues˄6% weight˅
                                                   ˄8% weight˅                                           ˄8% weight˅
                figures of 2017 sales revenues contribution  Nexans  return on net assets  figures of 2017 sales revenues contribution  NKT  return on net assets
                      per employee˄5% weight˅  ˄8% weight˅                  per employee˄5% weight˅  ˄8% weight˅
                                                                                          čABBĎ

                 Chart3-8 The competitiveness analysis of  ZTT in comparison during 2017  Chart3-9 The competitiveness analysis of  LS Cable in comparison during 2017
                                 sales revenues˄18% weight˅                            sales revenues˄18% weight˅
                                  2.0000                                                 2.0000
            The average growth rate of net profit for the  1.5000  The average growth rate of net profit for the  1.5000
               last three years˄15% weight˅    net assets˄13% weight˅  last three years˄15% weight˅   net assets˄13% weight˅
                                  1.0000                                                 1.0000
                                  0.5000                                                 0.5000
                                  0.0000                                                 0.0000
            The average growth rate of sales                       The average growth rate of sales
            revenues for the last three years  -0.5000  net profit˄13% weight˅  revenues for the last three years  -0.5000  net profit˄13% weight˅
                ˄14% weight˅                                          ˄14% weight˅
                                  -1.0000                                               -1.0000
           The ratio of international revenues to  return on total assets  The ratio of international revenues to  return on total assets
            total sales revenues˄6% weight˅        ˄8% weight˅    total sales revenues˄6% weight˅        ˄8% weight˅

                figures of 2017 sales revenues contribution  return on net assets  figures of 2017 sales revenues contribution  return on net assets
                      per employee˄5% weight˅  ZTT  ˄8% weight˅             per employee˄5% weight˅  LS Cable  ˄8% weight˅

               Chart3-10 The competitiveness analysis of  Hengtong in comparison during 2017  Chart3-11 The competitiveness analysis of  Ningbo Orient Cable in comparison during 2017
                                 sales revenues˄18% weight˅                            sales revenues˄18% weight˅
                                  2.0000                                                 2.0000
            The average growth rate of net profit for the  1.5000  The average growth rate of net profit for the  1.5000
               last three years˄15% weight˅    net assets˄13% weight˅  last three years˄15% weight˅   net assets˄13% weight˅
                                  1.0000                                                 1.0000
                                  0.5000                                                 0.5000
                                  0.0000                                                 0.0000
            The average growth rate of sales                       The average growth rate of sales
            revenues for the last three years  -0.5000  net profit˄13% weight˅  revenues for the last three years  -0.5000  net profit˄13% weight˅
                ˄14% weight˅                                          ˄14% weight˅
                                  -1.0000                                               -1.0000
           The ratio of international revenues to  return on total assets  The ratio of international revenues to  return on total assets
            total sales revenues˄6% weight˅                       total sales revenues˄6% weight˅
                                                   ˄8% weight˅                                           ˄8% weight˅
                figures of 2017 sales revenues contribution  return on net assets  figures of 2017 sales revenues contribution  return on net assets
                      per employee˄5% weight˅  Hengtong  ˄8% weight˅        per employee˄5% weight˅ Ningbo Orient Cable ˄8% weight˅
         18                                                                                                         18