
Page 19 - Analysis Report of Global Market in the Submarine Cable Field (2017)
P. 19
Ⅳ Analysis of Strength and Weakness of the Top 10 Competitiveness Enterprises in Competitiveness Index
Table 5-5-2 The analysis of the strength and weakness of the Top 10 competitiveness enterprises in the submarine cable field of global market
Sales revenues The ratio of The average growth rate The average growth rate
Sales Return on Return on
Company Ranking Net assets Net profit contribution per international revenue of sales revenues for the of net profit for the
revenues total assets net assets
employee to total sales revenues last three years last three years
Prysmian 1 ĭ ĭ į į į į į į į
NokiačAlcatel-LucentĎ 2 ĭ ĭ į į į į į į į
TE 3 ĭ ĭ į į į į į į į
NEC 4 ĭ ĭ į į į į į į į
Nexans 5 ĭ ĭ į į į į į į į
NKTčABBĎ 6 į ĭ į į į į į į į
ZTT 7 į ĭ į ĭ į ĭ į į į
LS Cable 8 ĭ ĭ ĭ į į į į į ĭ
Hengtong 9 į ĭ ĭ ĭ ĭ į į į į
Ningbo Orient Cable 10 į ĭ ĭ ĭ ĭ ĭ ĭ ĭ ĭ
Note 1:The explanations of the strength and weakness index system refer to the Note 7, page24
Chapter 4 Competitiveness analysis of "the Top 10 competitiveness enterprises in the wire
and cable industry of China"
Ⅰ Analysis of Financial Data
Table5-2-1 The standard value weighted of financial data of the top 10 competitiveness enterprises in the wire and cable
industry of China in 2017
The standard value weighted of financial data
Scale sub-factors˄weight 44%˅ Efficiency sub-factors˄weight 27%˅ Increase sub-factors˄weight 29%˅
Total The The
Ranking of Ranking of standard Sales The ratio of Ranking of average average
comprehensive financial data value Sales Net Net Total Ranking of Return Return revenues international Total standard growth rate growth rate Total Ranking of
Company competitiveness competitiveness weighted of revenues assets profit standard standard on total on net contribution revenue standard value of sales of net standard standard
index index the value value assets assets per to total sales value weighted revenues profit value value
financial weighted weighted employee revenues weighted of for the last for the last weighted weighted
of scale of scale of efficiency efficiency three years three years of increase of increase
weight weight weight index index weight weight weight weight index index weight weight index index
18% 13% 13% 8% 8% 5% 6% 14% 15%
Hengtong 1 1 2.6356 1.6984 0.4182 0.0566 2.1732 1 0.0472 0.2439 0.0121 0.0035 0.3067 1 0.1400 0.0157 0.1557 1
Baosheng 2 2 2.3318 1.7818 0.2717 0.0223 2.0758 2 -0.0002 0.0473 0.0599 -0.0006 0.1064 21 0.1400 0.0096 0.1496 3
Shangshang 3 4 1.9495 1.3035 0.2878 0.0318 1.6231 4 0.0559 0.0707 0.0603 -0.0005 0.1865 10 0.1397 0.0003 0.1399 12
ZTT 4 3 2.2199 1.3595 0.4507 0.0533 1.8635 3 0.0488 0.1211 0.0343 0.0032 0.2074 6 0.1400 0.0090 0.1490 4
Jiangnan 5 5 1.7683 1.0815 0.3504 0.0479 1.4797 5 0.0227 0.0834 0.0437 -0.0001 0.1498 15 0.1400 -0.0012 0.1388 14
Futong 6 6 1.5110 0.8241 0.3009 0.0352 1.1602 7 0.0339 0.1471 0.0312 -0.0019 0.2103 4 0.1400 0.0005 0.1405 10
Zhongli 7 7 1.5099 0.7730 0.3788 0.0233 1.1750 6 0.0378 0.1302 0.0133 0.0132 0.1945 8 0.1400 0.0004 0.1404 11
Tongling Jingda 8 8 1.1275 0.9128 0.1700 0.0122 1.0950 8 0.0335 0.0803 0.0526 0.0014 0.1679 13 -0.1400 0.0047 -0.1353 27
Hanhe Cable 9 9 0.8643 0.4999 0.3353 0.0399 0.8751 9 0.0384 0.0714 0.0206 -0.0005 0.1299 17 -0.1400 -0.0007 -0.1407 29
Zhongchao 10 10 0.8404 0.6146 0.0862 0.0030 0.7038 10 -0.0082 0.0477 -0.0161 -0.0026 0.0207 28 0.1213 -0.0053 0.1160 15
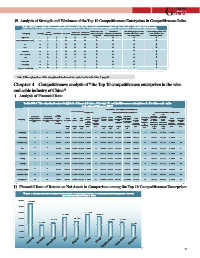
Ⅱ Financial Data of Return on Net Assets in Comparison among the Top 10 Competitiveness Enterprises
Chart4-1 The financial data of return on net assets in comparison of the top 10 competitiveness enterprises in the wire
and cable industry of China in 2017
Hengtong Baosheng Shangshang ZTT Jiangnan Futong Zhongli Tongling Jingda Hanhe Cable Zhongchao 19